
CPG GROWTH INTELLIGENCE

The market is not
one number.
It is a decision.

Category scale shows demand. Channel scale shows access. The commercial opportunity becomes useful only when the two are evaluated together.

22 CPG categories19 retail channels418 market combinations
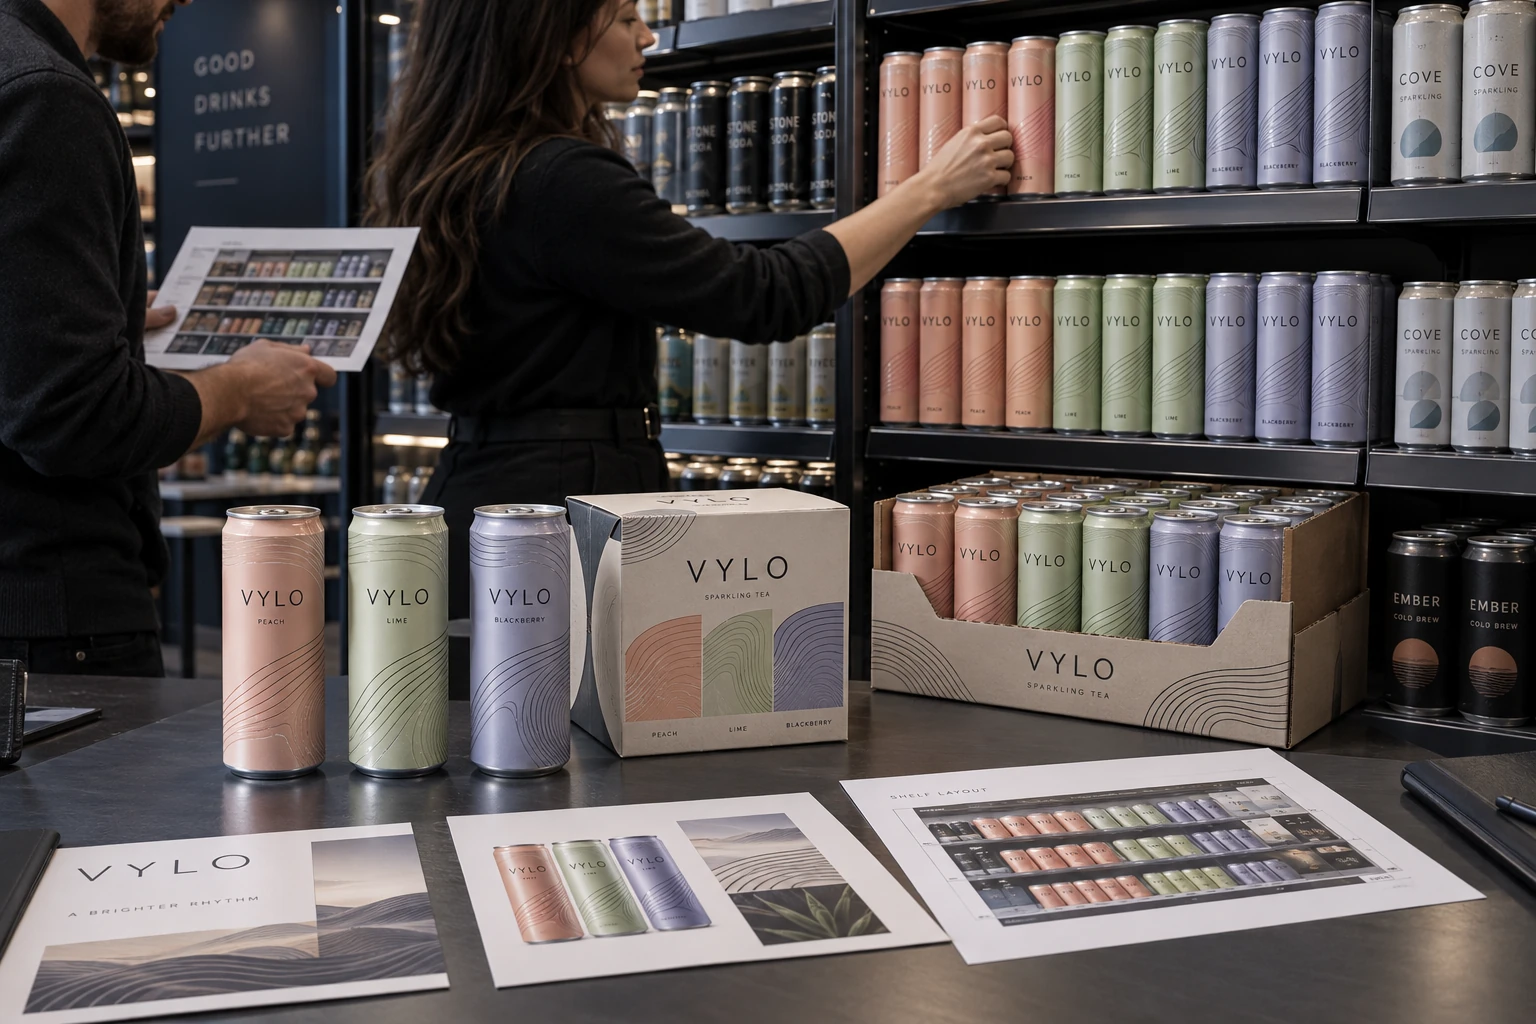
Retail assortment and shelf presentation reviewed alongside channel planning materials
MARKET SCALECategory demand × channel reality

BUILD THE GROWTH MAP

Choose the category.
Choose the channel.

Select any combination to compare category value and growth, channel value and growth, and the measured or modeled opportunity where they meet.

DERIVED / CORE CHANNEL CONTEXTMARKET VIEW READY

Measured exact public pair data · Derived related public data used transparently · Modeled a disclosed directional range based on cited category, channel and comparable-market data

CATEGORY MARKET

Food + edible grocery

MARKET VALUE$1TU.S. supermarket sales / 2025 · FMI
GROWTH+1.2%U.S. grocery dollar sales / 2025 YoY · NIQ / McKinsey

The channel carries an average of 33,248 items per store; being in the market is not the same as earning the shelf.

FMI SOURCE ↗
CHANNEL MARKET

Grocery

CHANNEL VALUE$915.4BU.S. grocery-store sales / 2025 · Census
GROWTH+2.7%U.S. grocery-store sales / 2025 YoY · Census

A high-scale, low-net-margin channel where assortment productivity, replenishment and trade economics matter.

U.S. CENSUS SOURCE ↗
THE SELECTED PAIR

Food + edible grocery × Grocery

CATEGORY × CHANNEL VALUE$915.4BBroad U.S. grocery-store sales / 2025 · Census
CATEGORY × CHANNEL GROWTH+2.7%Broad U.S. grocery-store sales / 2025 YoY · Census
CORE GROCERY ROLE

Edible grocery demand meets the weekly basket

Food and grocery are structurally connected, but distribution alone does not prove demand. ESI would pressure-test assortment role, shelf productivity, trade economics, service levels and the evidence required to sustain replenishment.

RELATED DATA ↗
WHAT ESI WOULD PRESSURE-TEST

Shelf productivity, margin discipline and repeatable replenishment.

  • Assortment and SKU role
  • Wholesale and trade economics
  • Case-pack and shelf fit
  • Distributor and retailer readiness
  • Velocity and replenishment evidence

*ESI directional estimate derived from cited public category, channel and comparable-market data. This is not audited point-of-sale data. Actual market size and growth vary by category definition, retailer coverage and measurement period and should be validated using licensed POS, retailer and distributor data before commercial investment or forecasting.

HOW TO READ THE MODEL

Three views.
One commercial decision.

The model establishes the scale and direction of the opportunity. It does not replace the product, economic, operational or channel work required to capture it.

01 / CATEGORY

Is demand large enough—and moving in the right direction?

Category value and growth establish the broader consumer market, not the sales available to one brand.

02 / CHANNEL

How large is the route—and what does it require?

Channel scale must be read with its economics, buying structure, pack requirements and operating demands.

03 / THE PAIR

What happens where this product meets this route?

Measured data is used where available. Otherwise, the model provides a clearly marked directional range—not invented precision.

FROM MARKET SIZE TO MARKET EXECUTION

The opportunity is visible.
Now build to capture it.

ESI determines whether the selected category-channel opportunity fits the brand, then leads the commercial, product, packaging, supply, distribution and retail work required to pursue it responsibly.

Discuss the opportunity Find your starting point Market information identifies the conversation. ESI leads the decisions and execution that follow.